
Reform policy options and market mechanisms can incentivise investments in flexible generation for renewable integration, and the right combination of capabilities in a power system can create total system optimisation. Examining different electricity market structures in the EU (specific member states) and the USA (specific markets), while not an exhaustive description of all markets and mechanisms, provides context for some essential developments contributing to the increased focus on flexible generation investments and their value. This article is based on the award-winning paper “Market reform policy – Case examples EU, USA and Australia: status and impact on investments” presented at the Power-Gen Europe 2016 conference.
Major drivers in US and EU energy markets
Renewable Energy
Over the last decade, many countries and regions of the world have shown strong commitment to decarbonising their economy. For example, in 2012, the earlier EU decarbonisation commitment was extended to 2030, and in October of that year it was further strengthened when the European Council adopted the following targets:
- At least 40% emissions reduction in EU greenhouse gas emission from 1990 levels
- Raising the share of EU energy consumption produced from renewable resources to 27%
- A 27% improvement in the EU’s energy efficiency *1
The energy sector is one of the main enablers of these objectives, and thus electricity production from renewable energy sources (RES) has increased strongly in the EU. Consequently, energy produced from conventional sources declined.
Although the energy produced from RES in the US is not as high – about 13% of the domestically produced electricity in 2015 – specific regions have had dramatic growth in installed wind and solar capacity over the last decade, which presents new challenges in integrating these variable sources. New utility-scale solar installations were expected to reach 9.5 GW in 2016 alone, which is more than the total from 2013 to 2015 combined (9.4 GW). New wind plants in 2016 were expected to reach 6.8 GW, a slight decline from the 8.1 GW in 2015.
The changing nature of electricity demand
Total electricity demand in the US and EU in recent years has been flat or even negative, due to several underlying factors. For one, higher demand growth is strongly linked to industrial output, but growth in the population’s wealth is no longer closely linked with industrial output. Instead, as consumers get wealthier, they move towards greater energy efficiency and the economy moves away from an energy-intensive industry focus to a more service-based focus. Another driver is the increased focus on energy efficiency and demand response by utilities and their regulators. This does not mean that no new generation investments are needed but rather that new generation resources going forward should provide a different value proposition than before.
Weather conditions ultimately determine when and how much energy can be produced by RES. Although forecast technologies improve, the resulting intermittent production is difficult to predict, especially for time periods long before actual delivery. Thus, dispatchable capacity is required to balance the fluctuating production from RES and maintain security of supply in the system.
Fluctuations can be over longer periods of time (when the wind stops blowing for several days) and very short intervals (when several GW of firm power is required within an hour). Therefore, the typical thermal investments of the past, CCGT plants for energy and low-cost gas turbines for peaking (capacity reserve), are being challenged by smaller, faster, yet still very efficient generators that can balance minute-by-minute the higher-volatility Net Load (demand minus variable output of renewable sources).
In addition to the total electricity demand, peak demand – defined as the highest instantaneous load on the grid – is a significant determinant of the shape and the size of the power system. In developed countries, growth in peak demand over the last decade has outpaced annual electricity demand. Our demand profiles are becoming “peakier” as relatively stable industrial demand is replaced by more variable commercial and residential demand. Adding to this the non-dispatchable renewable energy gives a much more volatile Net Load that must be balanced with much more flexible resources, both on the production side (flexible power generation) as well as on the demand side (Demand Side Response [DSR]).
Though solutions are available, investments in flexibility solutions are not materialising. In past years, policymakers have considered how electricity market design can be adjusted to provide market-based incentives for these technologies. By examining markets where an updated, Energy-only Market set-up was implemented and markets where a Capacity Mechanism (CM) was implemented, we evaluate whether these market arrangements lead to the desired outcome.
Review of electricity market set-ups
United Kingdom Capacity Market
Market design
In the context of wider decarbonisation goals, EU member states are rolling out renewable technologies rapidly. The UK must achieve 15% renewables share of energy by 2020, which translates to around 30% share of electricity from RES. As nuclear options face huge political and cost challenges after Fukushima, and the technical and commercial potential of Carbon Capture and Storage (CCS) remains to be proven, most new plants in the UK use wind (given the UK’s plentiful wind resources).
However, just as flexibility needs to grow with increasing volumes of RES, much of the UK’s existing fleet of dispatchable flexible resources is set to close (due to age and emissions regulations). This has raised concerns of capacity adequacy, which forms the basis for the Electricity Market Reform (EMR) capacity mechanism.
As part of its EMR process, the Department of Energy and Climate Change (DECC) has decided to implement a ‘market-wide’ capacity mechanism in the UK, in the form of a forward capacity auction with availability incentives and penalties. The rationale is to deal with the ‘missing money’ problem brought about by increasingly uncertain market-based revenues for thermal plants. The capacity mechanism will be technology-neutral (subject to technical availability requirements) and focused on ensuring overall capacity adequacy rather than on securing certain types of capacity. While this form of capacity mechanism may increase the UK capacity margin and reduce risks to supply security, it may not deliver the right mix of flexible capacity at the lowest cost to consumers.
Outcome
At the first CM auction held at the end of 2014, almost 50 GW of capacity won contracts at GBP 19.4/kW, of which the majority was for one-year contracts for existing generation. *2 A total of 2.6 GW of new capacity won 15-year contracts. Of this new capacity, 1.8 GW was accounted for by the Trafford CCGT project and 900 kW by smaller-scale, high-speed diesel reciprocating engines. The Trafford plant was bid into the capacity auction without financing and without a long-term tolling agreement to back it, and the company is struggling to secure an offtake contract and financing and may not be able to deliver against its 2018/19 capacity agreement.
The second auction at the end of 2015, aimed at securing capacity for 2019/20, saw just over 46 GW cleared at GBP 18/kW. Again, the majority was for one-year contracts for existing generation. The share of high-speed diesel reciprocating engines clearing the auction for new capacity was even higher compared to the 2014 auction.
The outcome of the two CM auctions clearly shows that this specific market design is not incentivising investments in new capacity, even though 5-10 GW of coal and CCGT plants will close over the next 18 months. Additionally, the CM does not provide any signal to the market to invest in flexibility. Only the technology with the lowest CAPEX is rewarded with CM contracts, and system-level benefits (such as integrating and enabling the use of more RES) are not taken into consideration. This leads to the strange situation where the UK is now subsidising diesel-fired generation, at a time when decarbonisation of the power system is high on the agenda.
Germany’s Strommarkt 2.0
Market design
After a broad consultation process regarding the electricity market design, the German Federal Ministry for Economic Affairs and Energy (FMEAE) decided in 2015 to develop the existing market into an electricity market 2.0 (EOM2.0). *3
The EOM2.0 is meant to strengthen the confidence of market players in competition-based price formation. The FMEAE will enshrine in law that pricing will take place based on competition. This means that high price peaks can occur, and the investment incentives of the market mechanisms can take full effect. Also, companies can offer prices that are higher than their marginal costs (“mark-up”). The incentives to uphold balancing group commitments will be strengthened by introducing marginal pay-as-cleared balancing energy prices based on cost-reflective imbalance charges. The balancing energy system provides the incentives for responsible parties to ensure they have contracted enough electricity to uphold their commitments.
In addition to strengthening the market, the FMEAE included an additional “security” component: to backup the electricity market 2.0 with capacity reserve. Unlike the capacity mechanism, the capacity reserve consists solely of power stations that do not participate in the electricity market and do not distort competition and pricing. These power stations will be used only if, despite free price formation on the wholesale market and contrary to expectations, supply does not cover demand at a given time.
Outcome
To understand and gain insights into the effects of the proposed EOM2.0, Wärtsilä commissioned Baringa Partners LLP (an energy advisory consultancy based in the UK and Germany) in 2014 to model the German market over the period 2020 to 2035 with the EOM 2.0 criteria. *4
The modelling work concluded that the EOM 2.0 creates strong incentives for flexibility as it targets financial incentives on flexible operation itself (instead of remunerating all types of capacity with the same level of payment as would be case in CM). Although the analysis is conservatively based on historic intra-day and ancillary service prices, Baringa observed an increase in the profitability of flexible resources relative to inflexible resources.
The profitability analysis also shows that flexible forms of capacity, such as gas engine power plants, are exposed to stronger incentives to invest. This is driven by superior operational capabilities, allowing them to collect additional revenues from operating flexibly in the intra-day and ancillary service markets.
These results highlight that market design choice can have significant impact on technology choice for investors. This analysis suggests that the EOM 2.0 is more likely to deliver more flexible capacity, which aligns with the future needs of the German system.
In December 2016 Wärtsilä won a contract to supply a flexible 100 MW combined heat and power (CHP) plant to Kraftwerke Mainz-Wiesbaden AG in Germany. This new highly efficient CHP power plant will enable the customer to operate profitably in the increasingly volatile power market and provide climate-friendly district heating to the community.
Southwest Power Pool (SPP), US
Market design
The market design in SPP consists of a two-phase settlement. Plant commitment, market clearing and ancillary service procurements take place in the day-ahead market settlement. Market players are not allowed to withhold capacity from the day-ahead market, and available capacity, including wind generation, must be offered. The second settlement takes place in the real-time market, which is a five-minute marketplace. All deviations from the day-ahead market clearing are covered through the real-time market.
The SPP market has 75,000 MW of installed generation capacity with a reserve margin of 47%. Compared against standard planning reserves of 15%, SPP has the largest reserve margin in the US. In terms of market dynamics, generators are in an extremely weak position to exercise market power and collect scarcity rents during high demand periods. The substantial amount of excess capacity usually creates poor fundamental conditions for peaking units to realise adequate returns to justify their entry on a merchant basis. However, SPP also has a rapidly growing fleet of wind generators that constitute over 10% of energy production, with wind providing 15% of energy by 2015. The combination of variable wind and over 25,000 MW of relatively inflexible coal generation creates conditions of high-variability real-time prices.
How can such a market provide opportunities for a new generation? The flexibility of supply resources in SPP responds to changes in load and addresses congestion problems. Generation responds dynamically to the changes in load to maintain proper balance between demand and supply. If ramp rates are too low, the market cannot respond quickly enough to manage system changes, and ramp deficiencies occur. Deficiencies result in price spikes and increase overall price volatility. From 2012 to 2013, ramp deficiencies increased by about 10% to approximately 100 events per year because of the added variability of increased wind generation and the decrease in ramp capabilities from online capacity. The deficiency in ramp capabilities manifests itself through higher, more volatile market prices for regulation services and energy. While these events are short-lived, they can create extreme changes in real-time prices. For example, real-time power prices are 300% more volatile than day-ahead prices.
Outcome
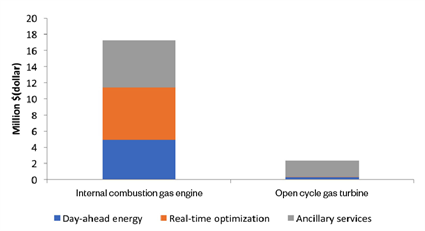
Ascend Analytics performed an independent market assessment valuing 200 MW equivalent of Wärtsilä 50SG engines and an open cycle gas turbine (OCGT) (a General Electric 7FA turbine was used) for the SPP Lubbock price node from 1 March to 1 September 2014. *5 The purpose was to assess the economic value of each asset under observed SPP market conditions. While both assets are flexible generators, they differ in their efficiency and responsiveness. The SPP market places a substantial economic premium on flexibility to react to the five-minute, real-time market.
The results confer the economic value of generation flexibility inherent in the gas engine relative to the OCGT. (Figure 1) Generation that can rapidly and efficiently respond to the SPP market price signals has substantial value over less flexible generation.
For 200 MW of equivalent gas engine and OCGT generation capacity, the engines realise 740% more value.
Fig. 1 - Annualised gross margin profit by market product for internal combustion gas engines and an open cycle gas turbine.
Electricity Reliability Council of Texas (ERCOT), US
Market design
The Electric Reliability Council of Texas (ERCOT), which operates the electric grid for most of the state of Texas, has experienced steadily growing demand over the last several years. From 2011 onwards, rising demand, generating unit retirements and the cancellation or postponement of several capacity projects presented challenges in maintaining adequate planning reserve margins. ERCOT carefully monitored its system resource adequacy, recognising a threat of declining reserve margin in upcoming years. These concerns spurred consideration of a capacity mechanism in ERCOT to attract new investment. However, in 2014, the Public Utility Commission of Texas decided to continue with the energy-only market design. ERCOT worked on market enhancements to provide adequate scarcity price signals together with enhancements in Real-Time Market design. The price cap was increased USD 9000 per megawatt-hour (MWh) to reflect the value of flexibility.
Outcome
Adjustments to scarcity pricing of the market, together with declining reserve margin, have boosted investment activity in ERCOT. Currently, there is more than 8000 MW of new peaking gas capacity in the development pipeline, and a couple hundred megawatts of capacity is under construction.
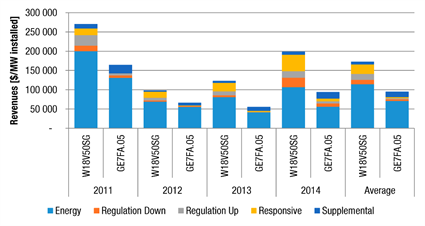
Wärtsilä has analysed historical ERCOT market pricing and the performance of open cycle gas turbines (a General Electric Frame 7FA.05) compared with Wärtsilä’s internal combustion engine gas technology (Wärtsilä 18V50SG engine) under various market participation cases. *6
To examine project feasibility and internal rate of return (IRR), detailed dispatch and financial modelling for both the OCGT and gas engine power plant in the ERCOT Day-Ahead (DA), Real-Time (RT) and Ancillary Services (AS) Markets for 2011–2014 was conducted. The gas engine power plant financially outperforms the OCGT due to the higher flexibility. The ability of the gas engine to start up within five minutes, reduce load to 20% of full capacity, and incur no maintenance penalties from frequent starts and stops allows the plant to participate in ERCOT’s Ancillary Services Market, offering variety of ancillary service products as shown in. (Figure 2)
Because of the longer start-up time of the OCGT and increased maintenance costs associated with frequent starts, the OCGT project could only offer limited ancillary services.
As market conditions predict, there will be higher price spikes in ERCOT in coming years and increasing demand for hedging products, which will drive up the hedge prices. The more valuable call option and ability to earn revenue from several markets further improves the business case for more flexible power plants.
Wärtsilä signed in September 2016 a major contract to supply a 225 MW Smart Power Generation plant to Denton Municipal Electric, the locally-owned utility for the City of Denton, Texas. The plant will provide balancing power to the community, which is moving towards a green, low emissions power system, aiming to have 70 % of its energy produced from renewables by early 2019.
Fig. 2 - The Wärtsilä 18V50SG generates more revenue than the GE 7FA.05 due to greater dispatch ability in markets.
National Electricity Market (NEM), Australia
Market design
The market design of the National Electricity Market (NEM) is a gross mandatory pool, where all generators are obligated to sell all produced electricity to the market. Correspondingly, electricity is bought by retailers from the pool. The market aggregates all generation and simultaneously schedules generators to meet the demand. This is managed through a central dispatch process, operated by the Australian Energy Market Operator (AEMO). Based on generation offers and demand bids, AEMO defines the most cost-efficient dispatch for every five minutes. The first indicative dispatch is computed a day before delivery. Redispatching, based on the adjusted bids, continues until five minutes before the actual five-minute dispatch interval. At the gate closure, the final dispatch and the dispatch interval prices are defined for the five NEM regions across Australia. Six consecutive five-minute dispatch interval prices are averaged every half-hour to determine spot prices for each 30-minute trading period.
Market rules define the market cap and floor price, which are currently 13,500 AUD/MWh and -1000 AUD/MWh respectively. A negative market floor price makes generators pay to stay online. This can occur when the cost of staying online is lower than the cost of shutting down and restarting a plant. A high market price cap serves as an incentive for new power plant investments. Most of the utilities in NEM are so-called gentailers (generator retailers). They have generation assets and load to serve. One important task for gentailers is to balance their own thermal generation according to their expected retail load and intermittent renewable output. This causes active rebidding just prior to the gate closure, occasionally creating significant price spikes.
Spot prices are highly volatile in the NEM, and market participants should manage their exposure to risks created by the price volatility. Generators and retailers manage their market price risk by using long- and short-term financial contracts, which ensure a firm price for electricity. These contracts are called Contracts for Differences and include swaps, caps, options and futures.
Outcome
In the NEM, OCGT plants have traditionally been used as peaking plants. Gentailers have used these plants as a physical hedge to protect their retail arm against market price volatility. However, superior flexibility of highly flexible power plants could enable more efficient market price risk mitigation, as well as significantly higher generation revenues.
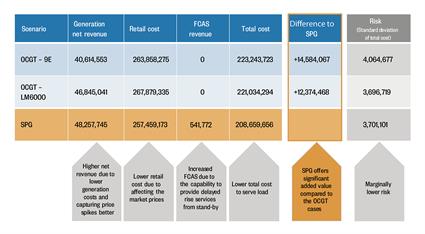
Wärtsilä engaged ROAM Consulting to carry out a study of the potential for internal combustion engine Smart Power Generation (SPG) power plants within a large utility portfolio in South Australia, operating in the NEM. A state-of-the-art modelling framework shows that an SPG peaking power plant can provide significant gross margin to the utility, compared to OCGT alternatives. At the same time, SPG decreases the risk exposure of the utility by reducing the volatility of annual returns. The benefits are based on the inherent operational flexibility of internal combustion engine (ICE) technology, especially the capability to reach full load in less than five minutes. Such agile operation enables a superior position in the five-minute market, compared to slower peaking plant technologies. The analysis shows that, in comparison with the aero derivative OCGT case, a 200 MW SPG power plant generates an additional gross margin of AUD 12.4 million for the selected utility in 2020. The gross margin is AUD 14.6 million compared to the heavy-duty OCGT case. (Figure 3)
In a year-long operation regime, the SPG plant is started 1054 times with 933 running hours, while the heavy duty OCGT is started 434 times with 395 running hours. The difference is due to the SPG plant’s operational capability to capture more market opportunities. Besides, the study results also show interesting system-level benefits. With 200 MW of SPG capacity as part of the portfolio, the average wholesale electricity price in the NEM is reduced by 4% compared to the heavy-duty OCGT case, with market prices of 41.3 AUD/MWh and 42.9 AUD/MWh, respectively. The price drop is result of the SPG plant being used to prevent disadvantageous price spikes for the utility.
Fig. 3 - Compared to the OCGT 9E and OCGT LM6000 cases, SPG enables significant added value due to the higher generation net revenue, lower retail cost and superior revenue in frequency control ancillary services.
Conclusions
Flexibility is required to integrate the increasing amounts of intermittent RES into a power system. The electricity markets described here clearly demonstrate the influence market design has on the type of future investments.
In several markets, flexibility provides value to stakeholders by rewarding dynamic capabilities. The mechanisms discussed in the German, SPP, ERCOT and NEM markets are essential to attract such investments and serve as examples for any market moving towards an optimal power system that is reliable, sustainable and affordable.
The examples also show that no specific government incentives or subsidies are needed to attract new investments in flexibility. A functioning electricity market that rewards performance in terms of flexibility, with close to real-time energy markets, price volatility and visibility, can provide the required incentives and guide investment decisions.
The UK example clearly shows the risks associated with capacity mechanism. Even though the capacity adequacy can be fulfilled through such a mechanism, it does not attract investments in flexibility and, therefore, does not support the transition towards a sustainable and affordable power system.
*1 Conclusions European Council, 23 and 24 October
*2 National Grid, Provisional Auction Results, T-4 Capacity Market Auction 2014, December 2014
*3 Federal Ministry for Economic Affairs, An electricity market for Germany’s energy transition, White paper by the Federal Ministry for Economic Affairs, July 2015
*4 Wärtsilä Stellungnahme zu der Grünbuch- Konsultation, Januar 2015, https://www.bmwi.de/Redaktion/DE/Dossier/strommarkt-der-zukunft.html
*5 Independent market assessment on Southwest Power Pool market, USA, https://www.wartsila.com/energy
Did you like this? Subscribe to Insights updates!
Once every six weeks, you will get the top picks – the latest and the greatest pieces – from this Insights channel by email.


