Advancements in CFD simulations have made the results comparable to data received from model basins. In this article, we compare how the simulators made by Wärtsilä Propulsion match up to real measurement data, revealing the shortcomings of the ITTC’78 extrapolation method.
Introduction
An important part of the design process of propulsion equipment is determining the performance of the parts. In the past, this could only be done with physical model scale experiments. Now, the numerical flow simulations (Computational Fluid Dynamics, or CFD) have developed to such a level that the simulations can provide similar results.
The advancements in the simulations have been a result of a continuous increase in computing power and improvements in software programs. Validation of the results with available measurement data either from actual sea trials or model scale experiments have contributed towards robust procedures and increased understanding of the occurring flow phenomena.
In this article, we discuss how the CFD simulations, as made by Wärtsilä Propulsion, show a good match with the measurement data.
Since Wärtsilä is providing the actual propulsion equipment to the customers, the focus has been on accurate prediction of the full-scale units. As the majority of the available validation data is based on model scale experiments, comparisons have been made between CFD results at model scale and full-scale. Here, the focus is on the scaling effects of open and ducted propellers.
Historical background
Evaluation of performance of marine propellers has been the field of model test experiments for decades. In order to transfer the results from the tests at small scale to the actual full-scale, extrapolation methods have been developed. The development of these procedures is coordinated by the International Towing Tank Conference (ITTC), where all model test institutes are represented. For the speed-power prediction of a certain vessel, the ITTC’78 extrapolation method is widely used. This methodology is 40 years old, and now some of the weaknesses of the extrapolation method have started coming to the surface.
When the method was developed, data was taken from full-scale vessels with open propellers. For single-screw and twin-screw vessels, the applicability of this method is still good. On the other hand, more recent developments have led to other types of main propulsion devices, like ducted propellers and azimuth thrusters, either with open propeller or with ducted propeller. Moreover, the introduction of several energy saving devices has added another degree of complexity. As a result, the conventional extrapolation method is losing its prediction accuracy.
The ITTC’78 extrapolation method is critically viewed from two sides. First, the deviation in findings at actual trials triggers the viability of this approach. But then, the gained knowledge on the occurring flow phenomena from viscous CFD simulations has provided new insights. Where these new insights get accepted, the consequences for the conventional methods can be reviewed.
Wärtsilä propulsion product portfolio
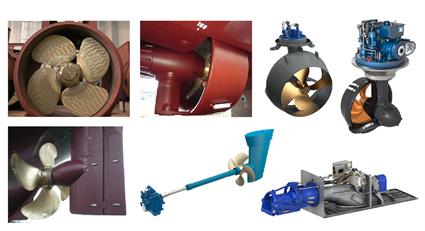
The portfolio of Wärtsilä propulsion products can be split into various families.
The shaft-line driven propellers are mostly applied for main propulsion applications. The propellers can be or either Fixed Pitch (FP) type or Controllable Pitch (CP) type. The latter is used often in combination with a four-stroke diesel engine, in order to be able to keep the propeller operational curves within the engine envelope. For various vessel types, such as inland, fishing and dredging vessels, nozzles are applied to boost the performance. At ship speeds above 15 knots, the drag of the nozzle exceeds the additional performance, which limits the application to certain types of vessels and sizes.
A second family is based on bevel gearboxes, where the driveshaft is oriented in a vertical direction. Examples of these units are azimuth (steerable) thrusters and tunnel thrusters. Again, these thrusters can be equipped with fixed pitch or controllable pitch propellers. Which one of the two variants is selected is often related to the layout of the rest of the driveline (E-motor, VFD or diesel engine). For vessel speeds above 30 knots, waterjet propulsion concepts are used. In the waterjet, the power is transferred through a mixed-flow pump into the water. The high pressure is converted into a high-speed jet, which can propel vessels up to 70 knots.
In this article, the occurring flow phenomena for open and ducted propellers were reviewed. It was observed that the Reynolds scaling effects can be different. The thrusters and waterjets performance evaluations were not addressed in this article since this has been addressed in other publications. [1, 2]
Fig. 1 - Wärtsilä propulsion product portfolio. (Click on the image for a full view.)
Open propellers
The first propulsion configuration that will be reviewed in this document is the open propeller. It can be either of fixed pitch or controllable pitch type. As part of the CFD implementation process for propeller performance simulations, Wärtsilä has spent a lot of effort in making comparisons with model scale experiments. By now, the CFD method has been scripted completely, which results in high precision of the simulations. With this automated method, a large number of propellers have been analysed and results have been compared with measurements from various well-known model basins.
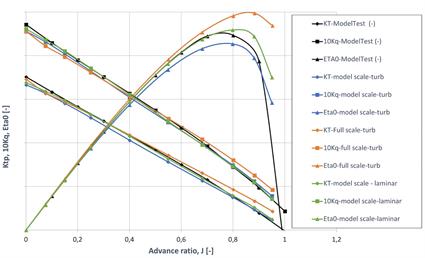
A large group of fixed-pitch propellers, with moderate blade area ratios, showed excellent agreement of model scale experiments and CFD simulations, in case the laminar flow regime was activated in the simulations. More details of the CFD simulations and the results are presented in the SMP2017 conference [3].
This phenomenon is clearly visible in Figure 2, where the green line has the best match with the experiments. The fully turbulent case on model scale is shown in blue, which gives a lower efficiency, due to a higher friction factor. The full-scale result exceeds the laminar-transition result by a few percentage points. When this result is compared to the full turbulent model scale result, then the differences due to shear stress become more in line with expectations. From this diagram, it can be concluded that the scaling effect of open propellers is fairly small due to the combined action of transition from laminar to turbulent flow and the reduction of wall shear stress due to increased Reynolds number.
Fig. 2 - Open water performance curves of open propeller: comparison of CFD simulations and model scale measurements. (Click on the image for a full view.)
Open propeller in behind-ship condition
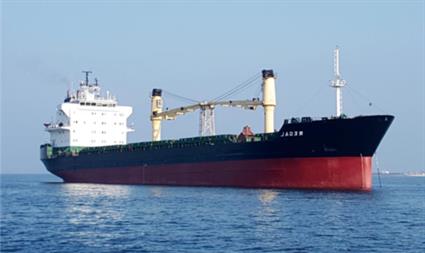
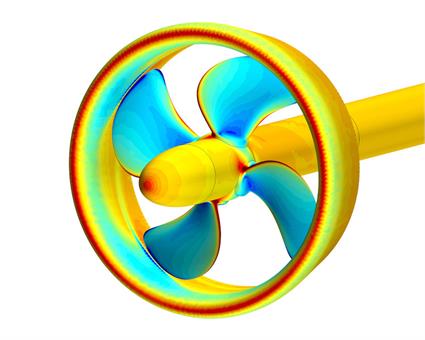
The Lloyds Register full-scale CFD test case is a well-known example (see Figure 3), which has been analysed by Wärtsilä as well. Detailed sea trials have been carried out on a single screw vessel with fixed pitch propeller. It could sail with three different propeller RPMs, and consequently it reached three different ship speeds. In the initial workshop, the ship speed reached and the shaft power required were not provided. The task for the participants was to calculate the expected self-propulsion point, thus providing the ship speed and required power.
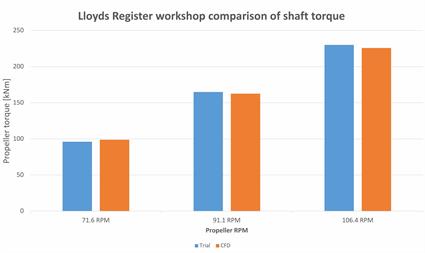
The validation of the CFD results was then based on the imbalance of thrust and resistance on the one hand and on the required propeller shaft torque on the other. In order to get a good match of the shaft torque, one has to model the propeller properly, but would also have to make sure that the inflow velocity is calculated accurately. The agreement, as shown in Figure 4, is good for all three sailing conditions where the propeller speed of the fixed propeller has been varied, resulting in different ship speeds.
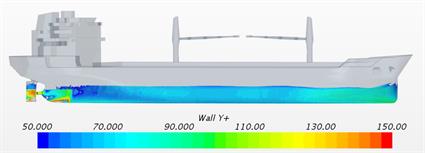
Fig. 3 - Lloyds Register full-scale CFD vessel and CFD model. (Click on the images for a full view.)
Fig. 4 - Comparison of measured and calculated propeller shaft torque for three different propeller RPMs. (Click on the image for a full view.)
Ducted propellers
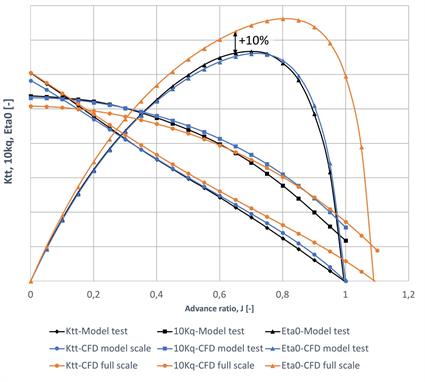
CFD simulations of ducted propellers revealed Reynolds scaling effects up to 10%. Since that value exceeds the usually experienced numbers with open propellers, it requires additional research. Figure 5 shows the open water performance of a ducted propeller from model scale measurements and CFD simulations. Accord between the model scale measurements and CFD simulations is important. From the knowledge we have of an open propeller, it is noted that for the ducted propeller simulations, a fully turbulent flow regime should be assumed.
The fact that an open propeller gives the best agreement with a laminar flow regime and a ducted propeller with a turbulent flow regime is already an indication of the Reynolds scaling having different effects.
This scaling problem has been reviewed from another perspective as well. In this approach, the ducted propeller, with small clearance between propeller tip and inner nozzle, is regarded as axial pump [4]. The transfer to the field of axial pump theory opens the door to literature of the last century, where Reynolds scale effects of 7–8% have been mentioned. This closes the gap of the observed scaling effects between the open and ducted propellers.
Fig. 5 - Open water performance curves of ducted propeller – comparison of CFD simulations and model scale measurements. (Click on the images for a full view.)
Ducted propeller in behind ship condition
Even though a fairly large Reynolds scaling effect of ducted propellers in open water condition has been found and explained, by definition, it does not mean that this scaling effect will be visible in same amount when the ducted propeller is placed behind the ship.
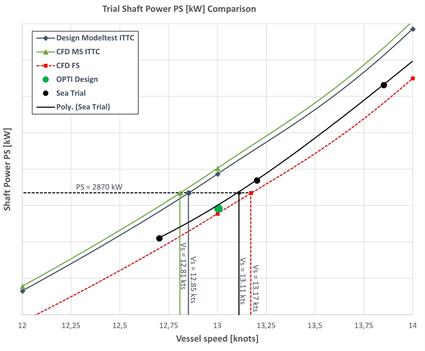
A confirmation can be found in Figure 6, where a full-scale trial data is compared with three different speed-power prediction methods as well as a dedicated CFD simulation of the complete vessel in calm water.
The blue line represents the performance prediction of the model basin based on the ITTC’78 method. In this method, the measured model scale open water performance is used. The solid green line is calculated in a similar way, but here the calculated open-water curve of the ducted propeller is used at as a model scale. The remaining interacting factors like wake-fraction and thrust-deduction were kept identical.
The difference between the green line and the dotted red line is the use of the full-scale open-water curve, which gives about 10% additional efficiency (see Figure 6).
Fig. 6 - Speed power curves for tanker with ducted propeller. (Click on the image for a full view.)
With this approach a reasonable accord is found between the range of measured trial conditions. This indicates that the interacting factors are relatively insensitive to the Reynolds scaling effects.
The full-scale CFD simulations of the complete vessel have been made for 13 knots sailing speed (marked with the green dot). The calculated power requirement matches well with the sea trial data. Results from the CFD simulations are shown in Figure 7 and Figure 8.
Effects of dynamic sinkage and trim are taken into account in the simulations to have as accurate a resistance as possible. This sinkage and trim is derived from the simulations with free surface and calm water. Local details like the nozzle connection bar are taken into account as well, as shown in Figure 8.
From the current results, as presented in Figure 6, it can be concluded that a reasonable prediction can be made, as long as the full-scale open-water performance curve is used and the CFD simulation of the complete vessel measurements is spot on.
On the other hand, the shortcomings of the standard ITTC’78 method are clearly visible with the offset over the whole range of sailing conditions. Results of the calculated wave pattern and the streamlines along the aft-ship are shown in Figures 7 and 8.
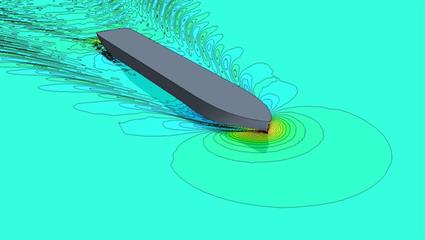
Fig. 7 - Wave pattern at 13 knots.
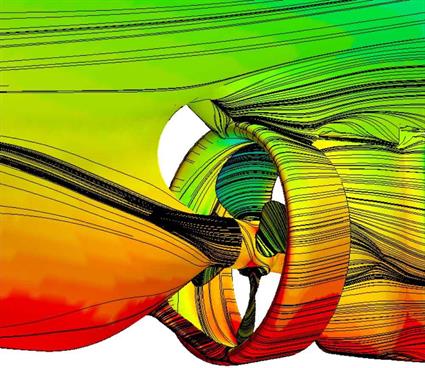
Fig. 8 - Limiting streamlines at aft-ship.
Concluding remarks
For the actual vessel performance prediction, a 40-year-old method is still commonly used in combination with model scale experiments. With the introduction of numerical flow simulation methods, the door has been opened to direct full-scale simulations. Comparison of the numerical results at model scale and full-scale has revealed the shortcomings of the ITTC’78 extrapolation method, and moreover, the full-scale CFD results have shown better agreement with actual full-scale vessel trial data. Whether the decision to eliminate the extrapolation method and move on to full-scale CFD stimulation is right or not will be further justified in the future by making comparisons with the sailing fleet.
References
1 Bulten, N.W.H., and Suijkerbuijk, R., ‘Full-scale thruster performance and load determination based on numerical simulations’, Proceedings 3rd International Symposium on Marine Propulsors SMP’13, Launceston, Australia, 2013
2 Bulten, N., ‘Numerical Analysis of a Waterjet Propulsion System’, PhD thesis Eindhoven University, 2006
3 Bulten, N. & Stoltenkamp, P., ‘Full-scale CFD: the end of the Froude-Reynolds battle’, Proceedings of 5th International Symposium on Marine Propulsors SMP’17, Espoo Finland, 2017
4 Bulten, N., Nijland, M., ’On the development of a full-scale numerical towing tank’, Proceedings 2nd International Symposium on Marine Propulsors SMP’11, Hamburg, Germany, 2011
Author: Norbert Bulten, PhD, Product Performance Manager, Wärtsilä Propulsion, mail: norbert.bulten@wartsila.com
